a – OCSiAl, Group, 1, rue de la Poudrerie, 3364 Leudelange, Grand Duchy of Luxembourg
b – Department of Chemistry and Biochemistry, New Mexico State University, Las Cruces, NM 88003, United States
c – NM Devices, Las Cruces, NM 88011, United States
Aqueous dispersions of single walled carbon nanotubes (SWCNTs) with surfactant were studied using a combination of differential sedimentation and dynamic light scattering methods. When applied to elongated particles like SWCNTs, the differential sedimentation method makes it possible to measure their’ diameters in dispersions, while the dynamic light scattering method allows to measure their lengths. Both methods have logarithmic dependence on the ratio between the length and diameter of the particles and their simultaneous use improves the accuracy of measuring particles’ dimensions. It was shown that sonication of dispersions leads not only to unbundling of agglomerates into individual nanotubes but also to a decrease in their lengths and appearance of new defects detectable in increasing the D/G ratio in the Raman spectra. Unbundling into individual nanotubes occurs after exposing to 1 kWh/L energy density and the single nanotube diameter with SDBS is ca. 3.3 nm larger than that of the naked nanotubes. Conductivity of thin SWCNT films made out of individual nanotubes demonstrates a power law dependence with the exponent close to the theoretical one for rigid rods.
Carbon nanotubes (CNTs) are widely used additives into various materials because of their unique properties: high electrical and thermal conductivity, high mechanical strength, and chemical inertness [1–3]. The quality of CNT dispersion in such materials affects the outcome, and its proper characterization is an important and not always simple task. Solutions of CNTs can be used as modifying additives, which are initially dispersed in an appropriate solvent. For this, various dispersion methods are widely used, for example, ultrasound, high-speed mixers, microfluidic and bead mills, superacids, etc. (see references in [1,2]). Depending on the particle size obtained, the properties of the resulting dispersions and of materials modified with such dispersions can vary greatly.
There are several methods for assessing particle size in dispersions, but often such methods do not allow in-situ measuring, as they require a special way of sample preparation. For example, TEM is a powerful tool for ‘direct observation’ of CNTs, but its application requires applying a drop of the sample to a special grid and subsequent drying, which can significantly change the structure of suspended particles. The same obstacles apply to another common method for studying nanoparticles, AFM, which also requires preliminary application of a dispersion on a substrate followed by drying. Moreover, when the aspect ratio is very high, it becomes difficult to identify the ends of the nanotubes on a large scale. Cryo-TEM has been proposed as a suitable method, as it has been popular in biology and other fields of science [4–5]. Nevertheless, it is associated with certain restrictions on the thickness of the samples and requires special expensive equipment making it inaccessible for routine studies of CNT dispersions.
Methods based on light scattering have several advantages associated with relative simplicity and availability of equipment and are widely used in studying macro-molecules in chemistry and biology. In addition, they allow studying samples of dispersions in-situ, without special preparation. Recently, several publications have appeared investigating dispersions of single- and multi-walled CNTs using the dynamic light scattering method (DLS). DLS is known to provide valuable information about the sizes of particles in dispersions, but its applications have been extended to unraveling information particles’ shapes and structures [6-10]. It was successfully used for evaluating liquid dispersions of carbon nanotubes [8-10], metal nanowires [11], and other nanomaterials. Light scattering by cylindrical particles depends on their shape, primarily the length but there is also a weaker logarithmic dependence on the diameter. Usually, one can assume a ‘reasonable value’ for the diameter to estimate the length of the particles. We demonstrate here that the use of analytical centrifuge (AC) provides complementary information about the diameter of the same particles in dispersions and thus improves the accuracy of the measured by DLS lengths. Analytical centrifugation allows separation of particles according to their rate of settling in a gravitational field, which is mostly dependent on the particles’ diameter. In combination with the density gradient method, this method has a high selectivity and allows separation of SWCNTs with different diameters, and, in special formulations, with different chirality [12, 13]. A weak dependence on the lengths permits separation of only extremely different in length SWNTs cases.
In this paper we apply a combination of the analytical centrifugation and dynamic light scattering techniques to study unbundling of single walled carbon nanotubes (SWCNTs) in aqueous solutions upon sonication with a surfactant (sodium dodecylbenzene sulfonate, SDBS). We demonstrate that the combination of methods allows more accurate measure of the particle diameters and lengths in a dispersion. We observed that sonication of the dispersions leads not only to unbundling of agglomerates into individual nanotubes but also to a decrease in their lengths and appearance of new defects.
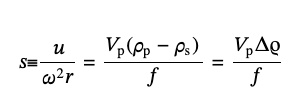
Motion of particles with different shapes in the field of gravity can be explained using the well-known hydrodynamic equations and for the purpose of AC technique, the sedimentation coefficient, s, can be calculated from the sedimentation velocity of particles, u, the rotational radial frequency of a centrifuge, ω, and its radius, r [14-17]:
(1),
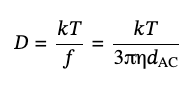
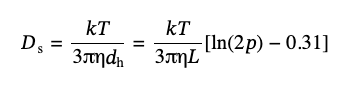
It can be related to the particle’s volume, Vp, the densities of the particle, ρp, and the solvent, ρs, and the friction coefficient, f, which dependents on its shape. The diffusion coefficient, D, for spherical particles with diameter dAC, is given by the standard form of Stokes–Einstein equation,
(2),
where kT is the thermal energy and η is solvent’s viscosity but it becomes more sophisticated for other shapes [16].
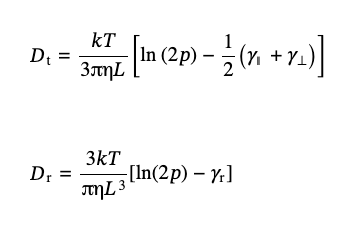
For the rigid rods with semispherical caps, Broersma [18] proposed the expression for the diffusion coefficients for translational, Dt, and rotational, Dr, diffusion:
(3),
where p = L/dr is the aspect ratio of the length of the rod, L, to its diameter, dr, and the parameters γ∥, γ⊥, and γr account for the caps’ effects and are defined below:
(4)
For a large aspect ratio, ln(2p) ≫ 1, corresponding to the last approximation in eq 4, the value of γ does not depend on the shape of the rod’s caps and is close to 0.31.The standard analysis of the experimental data provides diameter for the equivalent spherical particles, dAC, and the sedimentation coefficient value, ssp:
(5)
where Δρ stays for a difference of the densities of particles and the solvent. For the rigid rods in the limit of large aspect ratios, ln(2p) ≫ 1, from, from Eq. (3) it should be:
(6)
where Δρ′ also stays for the difference of densities of the rods and the solvent but here we account for a possible difference in the density of a nonhomogeneous material depending on its shape, like with the SDBS-coated nanotube.
Comparison of Eqs. (5-6) gives the expression for calculating dr from the diameter of equivalent sphere dAC:
(7)
where

This transcendental equation, in a general case, requires knowledge of L and can be solved numerically, but the dependence on the length is quite weak for large aspect ratios. For Tuball SWCNTs with the typical lengths of individual nanotubes 5 μm < L < 30 μm and their diameters 1.6 ± 0.4 nm, the aspect ratio L/dr for individual nanotubes and not very thick bundles conservatively varies between 1000 and 5000, which translates to ln(2p) varying between 7.0 and 9.2. Note that dr here should include a layer of SDBS molecules.
DLS provides the diffusion coefficients of particles and is based on measuring the intensity of the scattered light at some angles over time, I(q,t), and analyzing its autocorrelation function (ACF), G2, in accordance with the formula [6]:
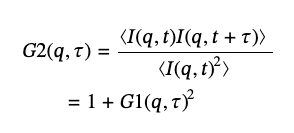
(8)
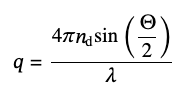
where G1(q,τ) – is the amplitude autocorrelation function and q is the modulus of the elastic scattering vector:
(9)
defined by the refractive index of the solvent, nd, the wavelength of light, λ, and the scattering angle, Θ. For monodisperse samples, G1(q,τ) is a single exponential decay with the decay rate, Γ:
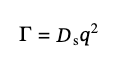
(10)
where Ds is the apparent diffusion coefficient of the particles, that for qL ≪ 1 can be calculated [6]:
(11)
In many cases, one deals with polydisperse samples, and the single exponential decay approximation does not describe the autocorrelation function well. To account for polydispersity, it is custom to use the so-called “cumulant analysis” [6] based on an expansion series of G1(q,τ):
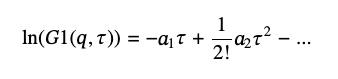
(12)
where a1 =<Ds> q2 gives the ensemble average diffusion coefficient, <Ds>, and the second cumulant, a2 ≥ 0, provides the measure of polydispersity of the diffusion coefficients distribution. (6) We will denote <Ds> as Ds and will use <Ds> for statistical average. Because of the positive value of a2, polydispersity effectively decreases <Ds> and thus the particles’ size. The greater its value, the greater the effect but [Eq 13] is limited only to small values of a2, a2/a12 ≪ 1.
Equation 11 is not valid for qL >> 1. Maeda et al. showed that, in a more general case, the following relation can be written:

(13)
where M(qL) is a monotonic function of the parameter qL, changing from 1.33 for qL → 0 to 2 for qL>>1 [19, 20]. The tabulated function M(qL) obtained by numerical calculations and given in [19, 20] (see Fig.S1) can be approximated by Eq. (S1) for convenience of calculations with parameters given in Table S1. This transcendental equation, in a general case, requires knowledge of d. but as mentioned for (eq 7), they can be solved simultaneously. The iteration method is most convenient, where in each consecutive step {i + 1}, values L{i + 1} and qr{i + 1} are calculated using values L{i} and qr{i} (see Eqs. (S2, S3).
Using small angles in DLS appears more attractive at first glimpse, as it is not affected by contribution from rotation and bending even for long fibers because of a small q in qL. Nevertheless, there are limitations of another kind. An increase in the concentration of particles in a dispersion hinders their diffusion motion, both translational and rotational. It manifests in the DLS as a slowdown in the decay of the ACF at longer times and thus to an apparent decrease in the diffusion coefficient. This effect is more pronounced at small angles. Thus, optimization of the procedure needs to be performed and will be discussed.
All experiments were performed with a single batch of SWCNTs Tuball, manufactured by OCSiAl. Pristine carbon nanotubes were dispersed in twice distilled water with Sodium Dodecylbenzene Sulfonate (SDBS, Sigma Aldrich) at nanotube concentration of 1 mg/mL and SDBS concentration 10 mg/mL. Dispersions were processed (sonicated) with a high-power ultrasonic tip processor (800 W, 22 kHz, Ultrasonic technological device “Volna” USTA-0,8/22) under continuous mixing and cooling with the total energy density applied from 0.015 to 20 kWh/L. The actual power released was calibrated separately using a water sample heating (details can be found in Supplemental, Table S5 and Fig.S14). Dispersions were found to have sufficient stability to be analyzed by dynamic light scattering and analytical centrifugation only for > 0.2 kWh/L energy density. Such initial dispersions were then serially diluted by water to produce dispersions with different concentrations.
Dynamic light scattering (DLS) spectra of SWCNT dispersions were analyzed using Zetasizer Nano ZSP. The measurements were performed at two angles, 173º and 12.8º, with laser excitation wavelength 633 nm. In each experiment the autocorrelation functions were collected in 2 min increments with automatic alteration of the angle with total of approximately 20 traces for each angle. There were occasional traces (< 5%) with obvious dramatic distortions due to unknown system fluctuations, which were excluded from the analysis. The acceptable traces were each fitted using Eq. (12) to get Ds and the set of these values was statistically analyzed to get the average value of L and its uncertainty.
Analytical centrifugation spectra were acquired with CPS Disc Centrifuge, model DC18000. All measurements were carried out at a speed of 17000 rpm using standard protocol with stepwise sugar density gradient and 0.05% of SDBS. A calibration standard of PVC latex particles (size 0.237 µm, CPS Instruments Inc.) was used in calibration of AC. The spectra for SWCNT dispersions were analyzed using Eq. (7) in conjunction with data for L from DLS. See text for details.
High-resolution TEM images were taken on a JEM-2010 instrument (JEOL Co.) equipped with an EDX detector for microanalysis. To do this, an aerosol from a suspension of SWCNTs with SDBS in water was sprayed onto a standard TEM grid and dried in nitrogen flow.
Raman spectra were measured using a Horiba LabRam Evo spectrometer equipped with a backscattering microscope on dried samples of dispersions prepared by drying a small droplet on a microscope glass slide. The spectra were measured at 532 nm using a 50× objective with the laser spot focused to 6 μm, but the radiation density was kept below 103 W/cm2 to avoid sample overheating.
We used spray-coating of the dispersions for making transparent conductive films on the PET substrates heated to 100 °C on a hot plate during the coating. The films were doped by nitric acid after washing in water and drying. The transmittance of each film was measured at 550 nm and ranged between 0.68 and 0.72 after subtraction of the substrate. The resistance of the films was measured using a four-probe technique, as described previously. (Measurements in five different places on each film were analyzed and the average over 2–4 films for each concentration with the standard deviation are presented as the result. More details are given in Supplemental.
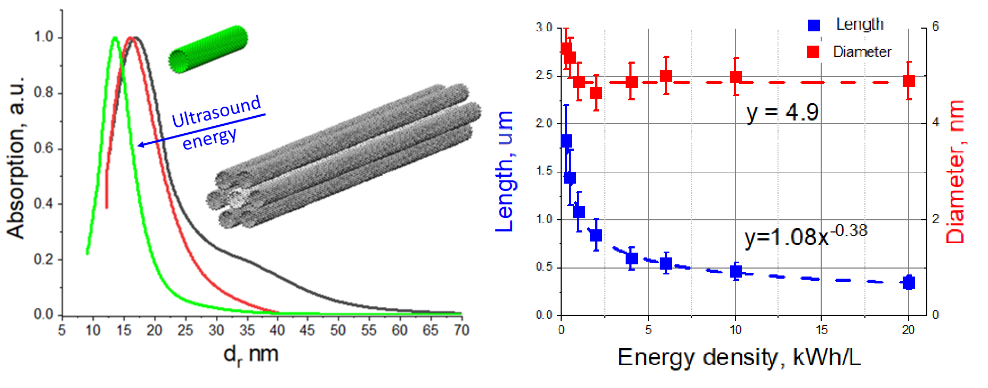
Typical sedimentation curves for dispersions of SWCNTs Tuball in water and heavy water with SDBS as a surfactant are presented in Fig. 1. These dispersions were produced by ultrasound treatment with the total energy density of 10 kWh/L. The dispersing is needed to separate bundles of SWCNTs into smaller ones and eventually into individual nanotubes. The curves are normalized at the maxima.
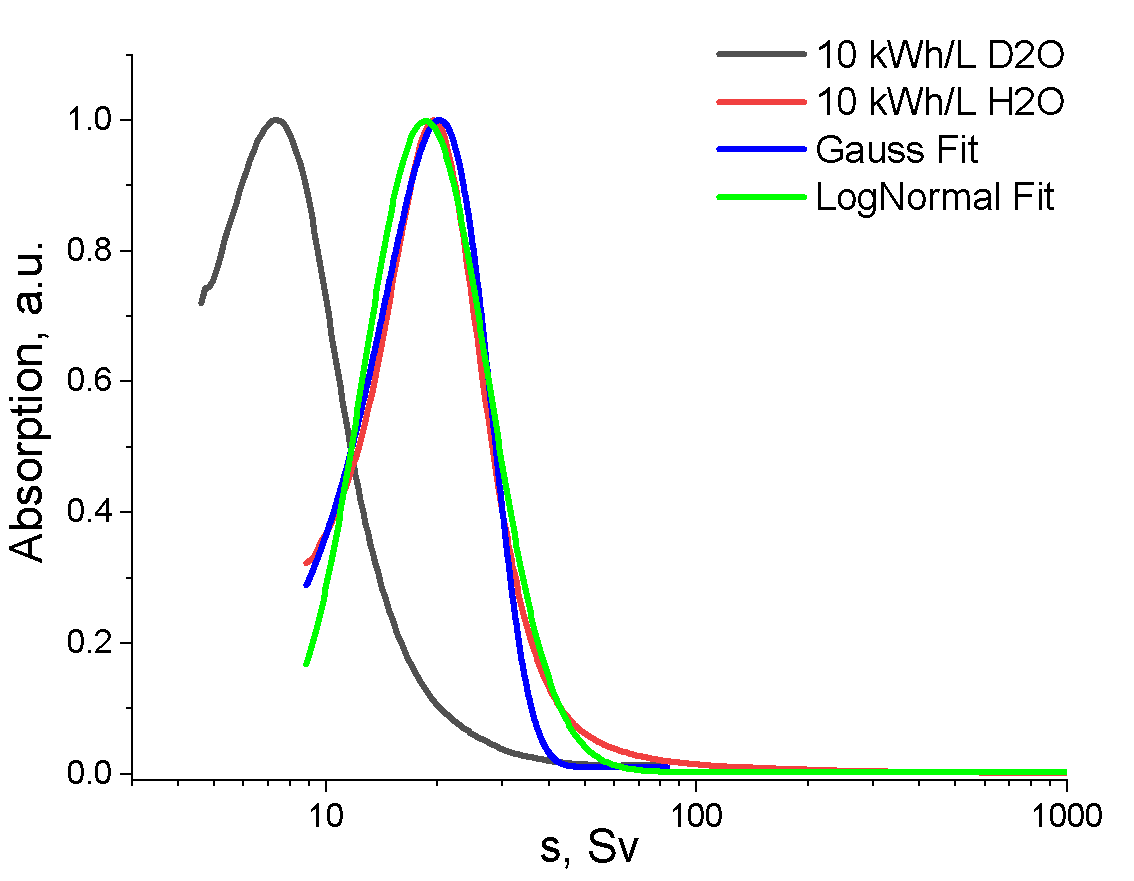
Figure 1. Sedimentation curve for the solution of 0.01 mg/mL of Tuball SWCNTs and 10 mg/mL of SDBS in H2O and in D2O. Theoretical log-normal distribution with the mean at 23.3 Sv and standard deviation of 9.4 Sv and normal distribution with the maximum at 20.3 Sv and standard deviation of 7.15 Sv (the width at half-maximum is equal to 16.8 Sv) are also shown..
For the sake of comparison, the lognormal and normal distributions with the best fit parameters are also presented in Fig. 1. One can see that the former approximates the experimental curve better. Nevertheless, the experimental curve has more pronounced “wings” for both regions: high sedimentation coefficients, corresponding to bigger particles, and lower coefficients - for smaller particles. It was reported before that the sedimentation coefficient for individual SWCNTs in aqueous dispersions with SDBS were near 13 Sv, in some cases even more, depending on the nanotube’s length [14]. Our experimental curve for solution in light water in Fig.1 has maximum at ~21 Sv and thus it is logical to presume that most of the distribution belongs to the individual nanotubes and the total curve corresponds to the distribution of their diameters with only a small portion on the right wing belonging to the bundles.
The diameters of these particles can be estimated using the rigid rods model in accordance with Eq. (6), but one needs to know the density of particles wrapped in surfactant and their length. The density can be experimentally measured by comparing data in different solvents, like in heavy water, also shown in Fig.1. As one can see, the maximum of sedimentation curve in heavy water is shifted to the smaller values because of a smaller difference of Δρ ′ for the particles with heavy water, as expected from Eq. (6). Increase of the viscosity of heavy water also contributes and was included. From this comparison the estimated density of SWCNTs wrapped with SDBS is 1.35 ± 0.03 g/cm3, which agrees with the previous literature estimate [14]. That allows recovering the diameter distribution of particles from the sedimentation curves of Fig.1 as shown in Fig. S2.
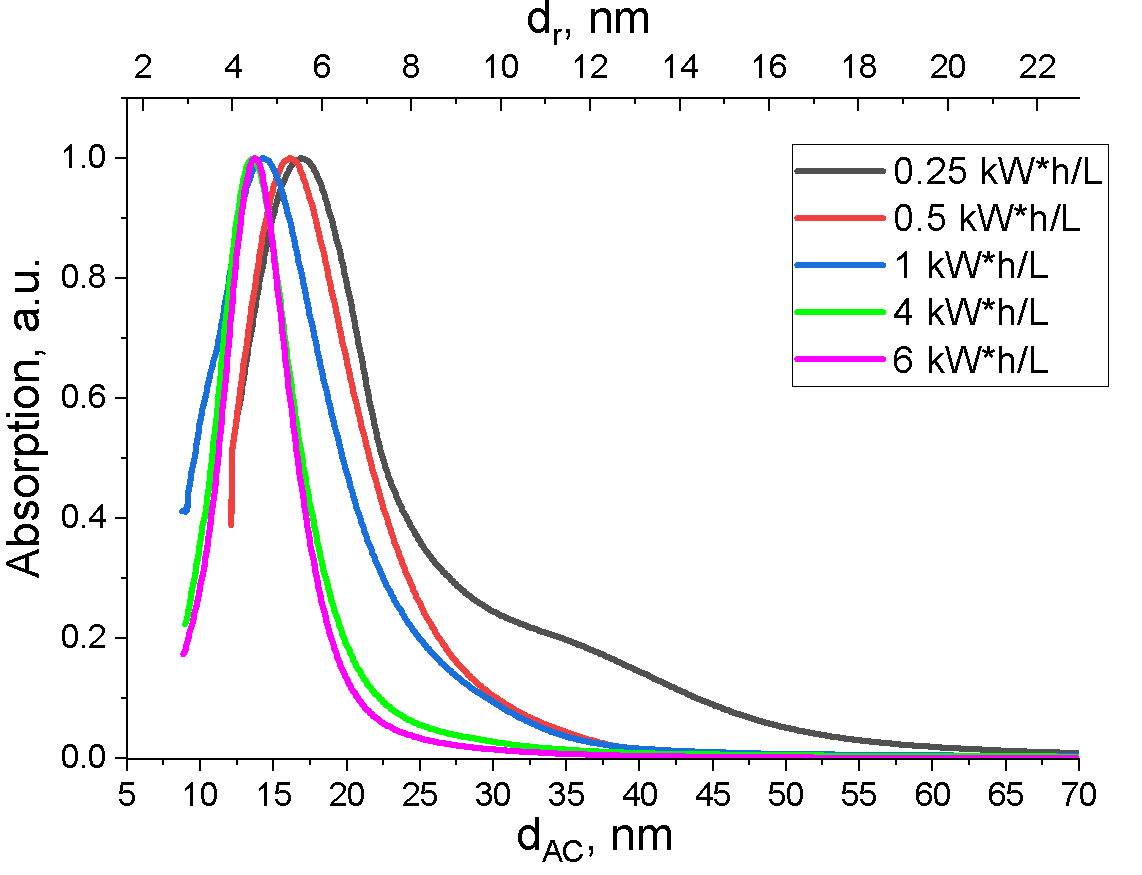
Figure 2. Bundle diameter distribution for dispersions at different sonication times. Different colors correspond to the different density of energy. The SWCNT concentration is 0.01 mg/mL for all dispersions. The bottom dAC scale from Eq. (5) and the top dr - from Eq. (7) with L = 1.08 µm.
Sonication for shorter times should demonstrate evolution of the bundles’ diameter from larger down to the individual nanotubes. Fig. 2 shows the experimental spectra for dispersions that were sonicated for different times. The bottom dAC scale was calculated using Eq. (5) and the top dr scale – using Eq. (7) with L = 0.46 µm. The length is not measured at this point and only guessed but weak dependence on L in Eq. (7) does not produce significant error. Simultaneous measure of L can improve the accuracy. The most noticeable changes in the dispersion characteristics occurred for the energy density changing from 0.5 to 1 kWh/L. Previously, it was shown that at such ultrasonic energy densities, the main characteristics of aqueous dispersions, such as optical density, stability, and viscosity, changed most noticeably [21, 22]. Further increase in the input energy density does not lead to significant changes in the optical density and stability of dispersions, although affecting the viscosity. Based on the dr value we can conclude that beyond 1 kWh/L energy density the dispersion consists of the mostly individual nanotubes wrapped in SDBS and further sonication has no effect of the diameters and only changes the lengths.
It was reported before [23–25] that agglomeration of nanotubes into bundles is concentration dependent and the equilibrium constant between the individual and agglomerated nanotubes changes with their length. We have verified the effect for our SWCNTs in the concentration range of interest. As Fig. S3 shows, the diameter distribution of SWCNT dispersions after sonication with 1 kWh/L energy density is practically the same for concentrations 0.01 mg/mL and diluted to 0.025 mg/mL, The most probable diameter for both, ~4.9 nm, thus corresponds to individual nanotubes and agglomeration of nanotubes in this range of concentrations is insignificant.
Fig. S4 illustrates the change in sedimentation curves when individual nanotubes form dimers, either in the head-to-tail and in the side-by-side form. The two versions illustrate that the diameter (side-by-side form) appears in the sedimentation curves more profoundly than the length (head-to-tail form).
The standard procedure for measuring particle’s size on a Zetasizer DLS implies the use of backscattered light at the angle 173°. Nevertheless, the optional measurements at a small angle 12.8° can also be performed. The autocorrelation functions at these two angles are presented in Fig. S5 for dispersion of SWCNTs with SDBS in water. The best approximations calculated in accordance with Eq. (12) are given for the initial portions of the curves G1.
As can be seen from the graphs, the behavior of ACF depends on the SWCNT concentration but it reveals differently at the large and small angles. For scattering at the large angle, the ACFs differ insignificantly for the two concentrations, 0.00063 and 0.01 mg/mL, while for the small angle, the difference is more pronounced. Note that for spherical particles, the autocorrelation functions measured at the two angles were practically identical, see Fig. S6.
The difference for the two angles becomes most apparent for ACF plotted against the reduced time, τ'=τq2, as shown in Figure S5b. The corresponding diffusion coefficients calculated from the curves at 173° and 12.8° angles are equal to 3.9 µm2/s and 1.0 µm2/s for the 0.01 mg/mL dispersion, respectively, and 3.9 µm2/s and 3.2 µm2/s for 0.00063 mg/mL. A difference in the diffusion coefficients for dilute dispersions measured at large and small angles is expected for elongated particles and has been experimentally found in a number of studies for such particles as fibrils, nanotube bundles, and DNA molecules6. Maeda et al. [19, 26] theoretically described that internal motions in flexible rods can be responsible for such differences. They showed that for flexible rods the light scattering at large angles involves additional degrees of freedom in the particles’ motion, which leads to an increase in the observed value of the diffusion coefficient. In the scattering at small angles, the flexibility effects practically do not manifest themselves and can be neglected. The ratio of the diffusion coefficients measured at the two angles can be used to estimate the value of the persistent length for elongated particles. Figure 3 shows that in our case, for dilute solutions, this ratio is below 2, which indicates that the persistence length of SWCNTs exceeds their length. Based on the proposed model [26], the internal degrees of freedom due to n links in a flexible chain can be accounted for as an effective increase in Ds, which for qL >> 1 can be written as:
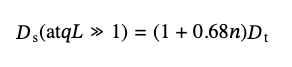
(14)
and thus, the ratio of diffusion coefficients at small and big angles should be 1 + 0.68n. Since the experimental ratio is less than 2, the effective number of the internal degrees of freedom does not exceed 1, i.e., SWCNTs in the dispersion are relatively rigid.
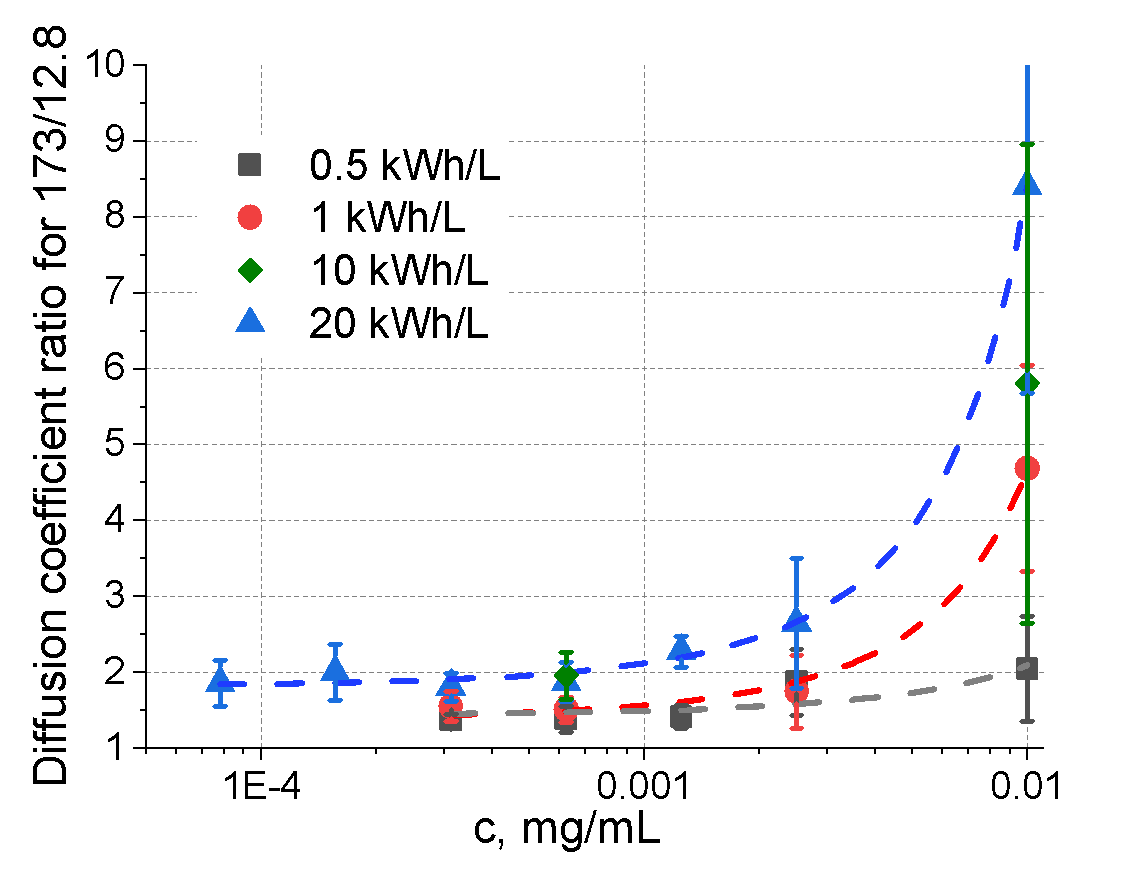
Figure 3. SWCNT concentration dependence for the ratio of apparent diffusion coefficients measured at 173° and 12.8° for the dispersions treated to the different density of energy. The dashed lines are guides to the eye.
The conclusion is in line with literature findings. Pasquali et al. [27] studied the dynamics of Brownian motion of individual nanotubes in aqueous dispersions by observing their fluorescence in a microscope. They concluded that the persistence length exceeded 3 µm. Sano et al. [28] analyzed with AFM the SWCNT rings obtained in DMF dispersions and concluded that the persistent length of the bundles was 0.8 ± 0.05 μm.
Figure 3 shows that the ratio of the apparent diffusion coefficients for 173° and 12.8° increases with the SWCNT concentration in the dispersions. It indicates a significant mutual influence of the particles. At concentrations above 0.001 mg/mL both translational and rotational diffusion are noticeably hindered. As previously reported [29, 30], in DLS such hindrance leads to a slowdown in the decay of ACF at long times and thus to an apparent decrease in the diffusion coefficient. According to the theory [29, 30], the translational and rotational motion of particles slow down for concentrations exceeding ~1/L3, where L is their length. For L ~ 2 µm it is approximately 0.001 mg/mL. As was shown by Doi et. al. [29], hindered diffusion at an increased concentrations decreases the rate of initial decay of ACF compared to dilute dispersions and, thus, decreases the apparent diffusion coefficient. The decay of ACF is described by the apparent diffusion coefficient Ds Ds, which depends on the concentration of particles, c, their length, L, and the scattering vector, q:
(15)
Thus, increasing concentration, c, should lead to a slower decay of ACF and a decrease in the apparent diffusion coefficient, DsD. At the same time, the ratio of the first cumulants for two angles becomes equal to the ratio of lengths of scattering vectors, q, which in our case equals 9. As can be seen from Fig. 3, the maximum value of the diffusion coefficient ratio approaches this value at high concentrations. This effect in concentrated solutions is a result of the particles’ hindered motion due to confinement from the neighboring particles in the direction perpendicular to the particles’ axis, while the parallel motion remains relatively free. Rotational movements are also limited to small angles.
Putting it all together, the proper approach to measuring dimensions of SWCNTs in dispersions using DLS and AC requires low concentrations, especially in DLS, where c < 0.001 mg/mL is necessary to fully eliminate the effects of hindered diffusion for nanotubes longer than 2 µm. Longer nanotubes would require even lower concentrations. Simultaneous solution of Eqs. (7) and (13) for dr and L (using iteration method with Eqs. (S2-S3)) gives the best possible accuracy for both. Theoretically, the DLS measurements at a small angle are less sensitive to flexibility of nanotubes but since the effect is not dramatic and the difference in apparent diffusion coefficient between the large and small angles is below 2, both types of measurements can be applied.
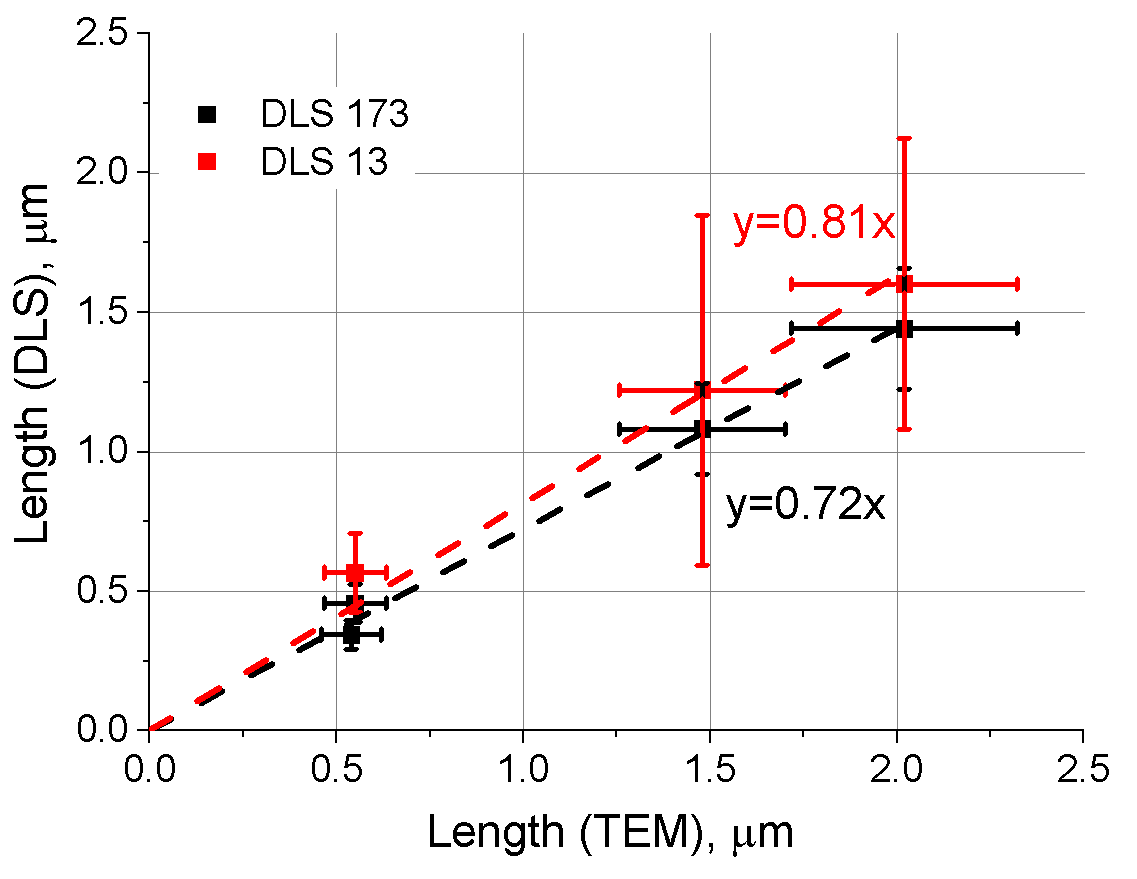
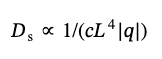
Figure 4. Comparison of the lengths found from TEM and DLS at 173° and 12.8° for the diluted dispersions at the concentrations below 0.0005 mg/mL.
In the TEM images of SWCNTs from dilute dispersions, we can identify nanotubes and their bundles and thus estimate their lengths for comparison with the DLS results. Examples of the length distributions obtained from TEM images are given in Figs. S7, S8. The distributions do not have sufficient accuracy for distinguishing their precise type due to limited statistics but, nevertheless, are sufficient for assessing the average values for comparison with DLS. The comparison of the average values obtained by TEM and DLS at 12.8° and 173° is shown in Fig. 4. The values measured at 12.8° exceed those for 173° by a factor ~1.13 but the slope is less than unity even for the small angle, where better agreement was expected. In any case, significant error bars for both types of measurements prevent one from making the above observation conclusive. Since the intensity of scattering is greater at 173°, and it is less sensitive to erroneous effects of hindered diffusion, measuring at this angle is more convenient. Polydispersity is the reason for slightly shorter values from DLS as compared to those from TEM. As mentioned above, distribution of particles by size appears in DLS with greater emphasis on the smaller ones. In Eq.(12), which is valid for small polydispersity, the positive value of the second cumulant responsible for polydispersity leads to an effective decrease of Ds and thus the particles’ size. As an illustration, we demonstrate Supplemental (Fig. S12) that an artificial distribution made of the two types of particles, 100 and 200 nm, with equal concentration shows ACF corresponding to the average particles’ size 11% smaller than the actual average diameter, 150 nm. Furthermore, we experimentally illustrate, also in Supplemental, the same effect using our solutions of SWCNTs after 2 kWh/L and 10 kWh/L ultrasonic treatment, where we have only individual nanotubes. The average lengths were measured to differ by a factor of 1.7, L = 774 and 455 nm, respectively, but their 1:1 mixture has ACF corresponding to the average length, L = 575 nm, i.e., 7% smaller than the calculated average, L = 615 nm (see Fig. S13). Thus, the polydispersity in solutions with broad distribution of SWCNTs can give on the order of 10% lower estimate for the length than the actual average value. It may explain the observed ~13% discrepancy in Fig.4.
TEM can also be used for assessment of the diameters, but the accuracy of such measurements is quite low due to a poor contrast of the edges at the amphiphile ends and likely assembly of the amphiphiles from solution at these edges. The resulting distribution shown in Fig. S9 illustrates that the average diameter measured this way is noticeably higher with a broader distribution.
Using the described recipe of simultaneous use of DLS and AC, we can measure the lengths and diameters of the nanotubes’ bundles in dispersions exposed to ultrasound treatment. Fig. 5 shows the results obtained for dispersions with different times of sonication. The values of lengths are given for the angle of 173°. As can be seen, both the lengths and diameters decrease with increasing the energy density of sonication, but the diameters stabilize at the value dr = 4.9 ± 0.4 while the lengths decline continuously with close to a power law dependence. Note that the first point is not at zero but at 0.2 kWh/L. This is because the quality of dispersions at lower energy densities is too poor for DLS and AC analysis. At that point, SWCNT bundles are already partially disassembled but the SWCNT lengths are also reduced significantly compared to the original lengths. The maximum length of the point at 0.2 kWh/L is less than the original lengths of SWCNTs, which can be measured using solutions of SWCNTs in chlorosulfonic acid. The pristine lengths of Tuball SWCNTs are significantly larger, over 5 µm [1]. We have verified that the discussed effects are scaling with the energy density and are not affected by the power density using additional experiments with a different ultrasound unit (see Fig.S11). The unfortunate conclusion is that the lengths of pristine SWCNTs in aqueous dispersions prepared with ultrasound treatment and surfactant cannot be measured properly, only the lower limit for the length can be estimated.
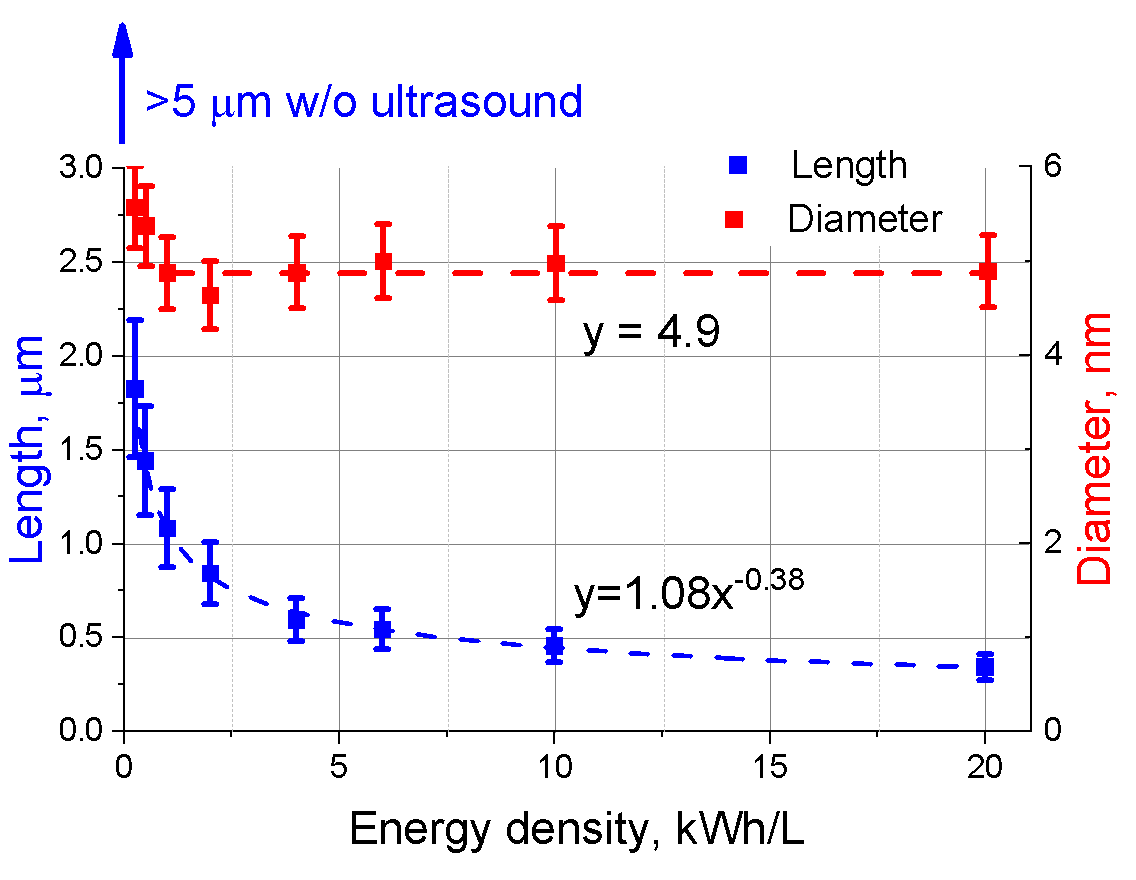
Figure 5. Dependences of the lengths (blue squares) and diameters (red squares) in dispersions on the energy density of ultrasound, corresponding to the distribution maxima in DLS and AC. The dashed blue line shows the best power law fit for the lengths and the red dashed line is a guide to the eye. The length without ultrasound treatment is greater than 5 μm.
The experimental dependence of the lengths of nanotubes/bundles on the time of sonication in the measured range can be approximated by a power function: L ∼ t–α, with the exponent α~0.38. Similar dependence on the time of sonication was previously reported with α ~ 0.5 for aqueous dispersions of both SWCNTs and MWCNTs [31-33]. The origin of that power law trend is not obvious. It is interesting to compare it with the kinetics of accumulation of defects.
Raman spectroscopy can provide such information. The concentration of defects in CNTs and graphene can be monitored using the ratio of intensities of the G and D bands [34–37]. The D band appears due to defects either gained during synthesis or caused by additional treatment, such as irradiation with ions or chemical oxidation. Mechanical treatment, such as bending and folding in cavitating bubbles produced by ultrasound waves, breaks the nanotubes apart into single ones and also shortens their lengths. The breaking should not happen ‘successfully' at every attempt but leave the nanotubes with defects on the ‘unsuccessful’ attempts. Thus, one would expect that the defects would accumulate not slower than shortening of their lengths. Fig. 6 shows that the G/D ratio does decline with the sonication energy, but the rate of its decrease differs from that for the length. Interestingly, the G/D ratio also declines following a power law but with a smaller exponent, α ~ 0.23. Note that the initial point falls out of the trend and this power law decline starts after the first point at ~ 0.01 kWh/L, where a significant portion of the decline takes place, almost by a factor of two. The cause of this discrepancy with the anticipated larger exponent in the case of defects is not obvious. One possible explanation is that breaking of SWCNTs occurs over the defects with much greater efficiency. Then shortening of the nanotubes can proceed almost without producing new defects or producing them at a smaller rate. The initial step of sonication, where most of nanotubes are in the bundles, is indeed less successful in their unbundling and produces defects from ineffective attempts instead.
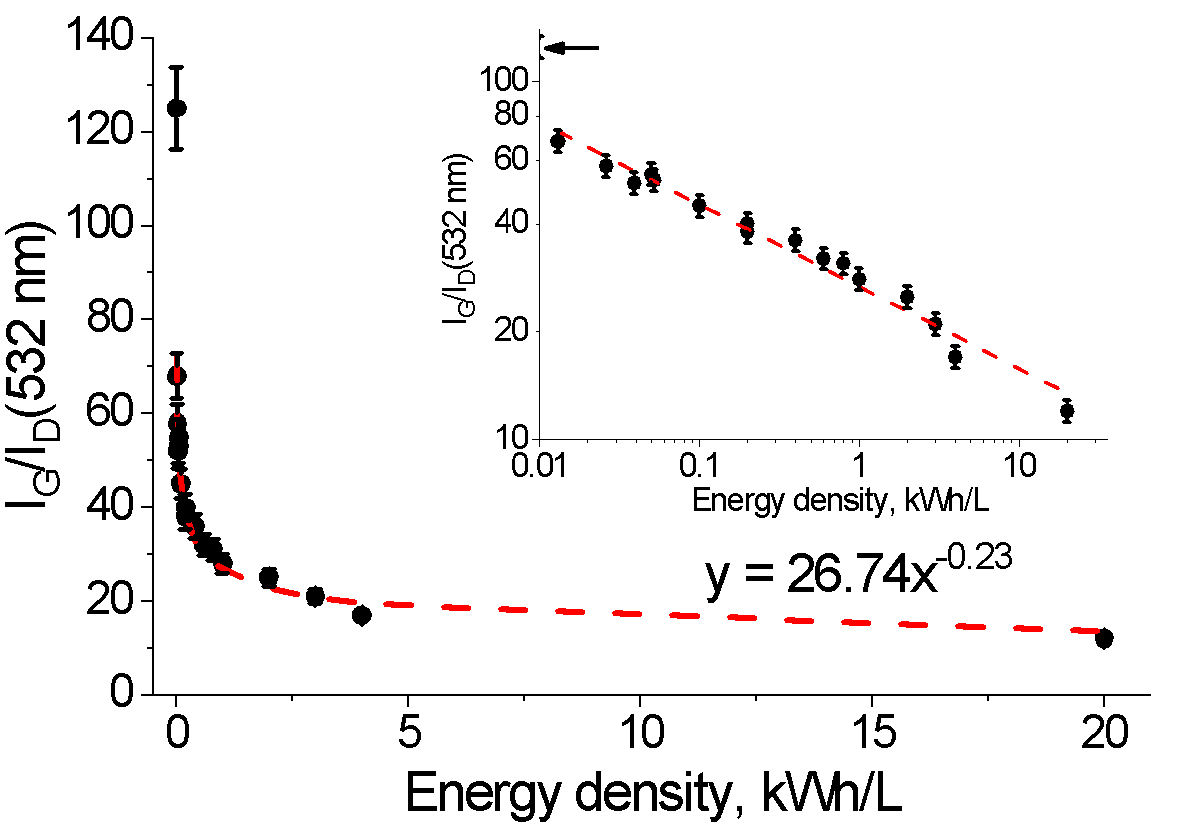
Figure 6. The ratio of the Raman G to D band intensities as a function of the ultrasound energy density. The Raman spectra were measured with 532 nm excitation. The dashed lines in the graph and in the inset show the best fit power trend. The inset reproduces data in the log-log plot.
The initial diameters of the first two points in Figure 5 correspond to bundles that upon further ultrasound treatment disperse into individual nanotubes and, starting from ∼ 1 kWh/L, that diameter does not change, i.e., it corresponds to the diameter of single nanotubes wrapped into SDBS. The issue of the mode of surfactant molecules wrapping over the surface of SWCNTs in aqueous dispersions was discussed in a number of papers. [38−40] Various models for SDBS molecule assembly at the surface were proposed. MD calculations suggested that the most probable is orientation of the aliphatic chain of SDBS along the CNT surface with the sulfur atom located ∼6 Å away from the SWCNT surface. [38] Since the outer diameter of Tuball SWCNTs is 1.6 ± 0.4 nm, [1] it can be expected that the diameter for this so-called “head-to-tail” conformation of SDBS would be dr ∼ 2.9 nm. It was also suggested that another conformation, “tails-on”, corresponding to the thickness of the shell close to the length of SDBS molecules, ∼2.1 nm, is preferable at higher SDBS concentrations, >10 mg/mL. [39] It corresponds to the dr diameter of individual SWCNTs of about 5.8 nm. Our results show a distribution of diameters from ∼3 to ∼6 nm with a maximum at dr ∼ 4.9 nm, which is between the values of the two extremes but closer to the expected for high surfactant concentrations. Figure S10 shows that the width of distribution in the sedimentation curve is higher than can be explained by obvious factors such as the Brownian motion, responsible only for 1/6 of the width, and the polydispersity of the lengths, contributing less than 1/3 of the width. Thus, the spread of diameters due to various modes of SDBS wrapping around SWCNTs along with the distribution of the nanotubes’ diameters themselves seem to be the major contribution to the broadening in AC.
It is known that thin films prepared out of SWCNTs have conductivity, σ, strongly dependent on their lengths. [41,42] Our films also show a strong dependence, as illustrated in Figure 7, but they uniquely demonstrate that the dependence on the length is very close to the theoretically expected (43) power law, σ ∼ L2.48. If only the points corresponding to dispersions with individual nanotubes were used, i.e., for the energy densities E > 0.5 kWh/L, the best fit gives σ ∼ L2.23 dependence. It is an additional confirmation that the rigid rod approximation works well for SWCNTs of such lengths. The previously reported experimentally measured exponents ranged from 1.46 to 1.7 and that was due to poorly controlled diameters of the bundles. [41,42] The departure from the trend in Figure 7 for E = 0.25 kWh/L corresponds to conditions with not fully dispersed into individual SWCNTs and is an indication of a strong dependence of the contact resistance on the diameter of bundles (∼dr3). (42) The absolute value of conductivity depends on the quality of contacts that might be affected by the presence of a residual surfactant. The films were thoroughly washed with water to ensure its removal, and FTIR spectra confirm that. In any case, whatever minute amounts of SDBS are left, it should be similar for all samples as the same procedure for washing was used. By virtue of our preparation method, the nanotubes are randomly oriented, which was verified by the absence of optical absorption anisotropy of the films.
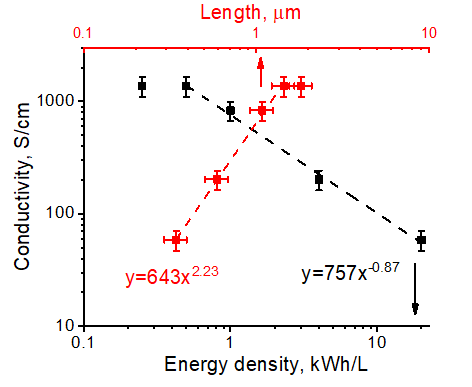
Figure 7. Dependences of the SWCNT films conductivities on the ultrasound energy density and SWCNT lengths.
It is known that thin films prepared out of SWCNTs have conductivity, σ, strongly dependent on their lengths [41-42]. Our films also show a strong dependence, as illustrated in Fig.7, but they uniquely demonstrate that the dependence on the length is very close to the theoretically expected [43] power law, σ ~L2.48. If only the points corresponding to dispersions with individual nanotubes were used, i.e., for the energy densities E > 0.5 kWh/L, the best fit gives σ ~ L2.23 dependence. It is an additional confirmation that the rigid rod approximation works well for SWCNTs of such lengths. The previously reported experimentally measured exponents ranged from 1.46 to 1.7 and that was due to poorly controlled diameters of the bundles [41,42]. The departure from the trend in Fig.7 for E = 0.25 kWh/L corresponds to conditions with not fully dispersed into individual SWCNTs and is an indication of a strong dependence of the contact resistance on the diameter of bundles (~dr3)[42]. The absolute value of conductivity depends on the quality of contacts that might be affected by the presence of residual surfactant. The films were thoroughly washed with water to ensure its removal and FTIR spectra confirm that. In any case, whatever minute amounts is SDBS left, it should be similar for all samples as the same procedure for washing was used. By virtue of our preparation method, the nanotubes are randomly oriented, which was verified by the absence of optical absorption anisotropy of the films.
Characteristics of particles in ultrasonicated aqueous dispersions of SWCNTs with SDBS were analyzed using a combination of differential sedimentation in analytical centrifuge and DLS methods. The analysis shows the validity of the rigid rods model in both techniques for describing SWCNTs. The rate of sedimentation is mainly determined by the diameter of carbon nanotubes coated with surfactant, with logarithmic dependence on the SWCNTs length. In contrast, DLS results are mainly defined by the SWCNTs length, with logarithmic dependence on the particles’ diameter. We demonstrate that the simultaneous use of these two methods improves the accuracy of measuring the diameter and length of SWCNTs in dispersions.
Comparison of the DLS correlation functions measured at a large angle (173o) with that at a small (12.8o) angle demonstrates insignificant contribution of SWCNTs flexibility, at least for the experimental lengths < 2 µm.
Ultrasound treatment not only helps disperse the bundles into individual SWCNTs but also shortens them. The observed diameters decline with treatment but level off for ≥1 kWh/L at ∼4.9 nm, which corresponds to the diameter of individual SWCNTs coated with a surfactant shell. The length of the particles in the dispersion continuously declines with the input energy of ultrasound, E, and follows a power law, L ∼ E–0.38. The ratio of G and D modes in the Raman spectra that corresponds to the inverse density of defects in SWCNTs also decreases with the time of treatment following the power law but with a smaller exponent. This suggests that breaking of SWCNTs preferentially proceeds at the defects.
Conductivity of thin SWCNT films made from individual nanotubes demonstrates a power law dependence, σ ∼ L2.23, with the exponent close to theoretical 2.48 for rigid rods.
Supporting Information includes the following topics: Iterative method of simultaneous solution of Eqs.(7) and (13) for a general case, comparison of distributions , effects of agglomeration, autocorrelation functions fitting, comparison with spherical particles, TEM analysis of lengths, analysis of the width in AC, effect of ultrasound power, conductivity of thin films.
Email: snsm@nmsu.edu
AK, VS, MP, and SNS designed the experiments and wrote the paper, YM measured and analyzed Raman spectra, AK and VS performed all the other experiments. All authors have given approval to the final version of the manuscript.
The authors declare no competing financial interest.
The research was done without external funding.
For Table of Contents Only